![]()
Case Study –Large National Telecommunications Services Provider
Situation
- Absence of a rigorous method for forecasting loads and productivities
- Significant variances in divisional forecasts restricting ability to proactively plan work, overtime, technician transfers
- Inability to plan at the district level resulting in sub-optimal execution to the divisional plan
- Limited capability to increase Customer Service levels and contain churn
- No rigorous process to optimally trade-off budgets and Customer Service
- Unanticipated call volumes
- Lower-than-expected productivity
- Higher than expected overtime
- Inability to get technicians when needed and off load when not needed
- Absence of easily understandable and actionable reports
- Field managers unable to make decisions with inconsistent and inaccurate information
- Lost productivity due to time spent on reconciling inconsistent information
Solution
- Application of causal forecasting based on historical data
- Development of a capacity planning model that simultaneously maximizes customer service levels with labor budgets
- Development of a bottoms-up technician requirements plan by district by day, considering local constraints
- Design and implementation of a daily planning workflow that allows for what-if planning and proactive decisions for forecasted events
- Standardized management reports that summarizes plans, reconciles dispatch operations with financials, and provides advance insights
- Continuous analysis of load patterns and behaviors to improve models
- Consolidation of multiple plans and reports into one application
Results
- Increase in incoming loads forecast accuracy from 70% to 85% range
- Increase in productivity forecasts from 70% to 90% range
- Decrease in average opening loads by 23%
- Increase in the # of days opening loads within targets by 50%
- Decrease in the variability (standard deviation) of opening loads from 44% to 18%
- Decrease in $ spent per trouble ticket during weekend, by 30%
- Decrease in $ spent per trouble ticket all days by 5%
- Decrease in overall labor spend by 5-8%
- Increase in district level customer service index on average by 5%
Solution Features and Functions
Robust Forecasting/Capacity Management Model
- Consideration of a number of causal factors – weather (precipitation, temperature etc), calendar, infrastructure and load conditions
- Combination of multiple regression, time series and other statistical techniques
- Continous analysis of additional factors
Actionable Reports
- View openings, clears and incomings for repair and install, for multiple days
- View resource plans, overtime, productivity and financials by district
- ‘What-if’ provisions to evaluate multiple options and strategies (example – ALAP – ‘Use overtime – as late as possible’)
- Trade-off Customer Service with budget variance by modifying techs, overtime etc
Management Decision Making
- Quick graphical view, zoom in and zoom out of areas in ‘green’ vs areas in ‘trouble’
- Summary and hierarchical views of regions, areas, and districts level information in a single, shared repository
- Ease of management decision making and operations tracking
Metrics, Measurements, Process Discipline
- Incoming forecasts vs actuals
- Productivity forecasts vs actuals
- Budget variances, customer service targets
- Incoming load variability
- Labor spend in $ spent per trouble call
- Institutionalization of planning process
- Accountability for managing to targets
The Solution Approach
As the adjoining graphic shows, our solution approach
- Leverages a pre-defined forecasting and capacity management model
- Is tailored to interface with incoming feeds
- Generates plans and reports that are actionable
Advantages of the approach
- Provides the ability to capture and track external causal factors in a non-invasive manner
- Provides bottoms-up plans as opposed to tops-down plans that are inherently sub-optimal
- Facilitates model upgrades to adjust to changing circumstances
- Keeps the TCO of the solution low
Deployment Models
We can either deploy the solution within your organization’s walls and provide ongoing support for the maintenance of the models or we can maintain the models within our facilities and provide you operational plans at a pre-set frequency, whichever model works best for your environment.
Methodology
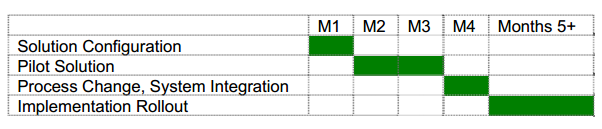
Shown here is a typical implementation cycle – short, systematic, yet comprehensive
Why Us
- 15+ years average experience in
- Planning, operational and managerial experience at Fortune 50 companies, Big 5 consulting and Supply Chain software companies
- o Process Design, Solution Development background using Advanced Statistical Modeling, Systems Engineering and Financial Analysis
- Proven track record of successful implementations and documented benefits
- Unique approach to problem solving combining proprietary models, process discipline and technologies